What Replicate Measurements Tell You About Precision and Trueness
Compare repeat injections with independent preparations. Calculate the sample standard deviation and document any difference from an assigned reference.
Precision describes the spread of repeated measurements under specified conditions. Trueness concerns agreement between the long-run mean and a suitable reference value. A small standard deviation can coexist with a measurable difference from that reference.
Describe the measurements you repeated
Write down the units, the quantity measured and what changed between replicates. Three injections of the same prepared solution mainly describe variation in injection and measurement. Three independently prepared portions of a common material also capture preparation variation. Separate vials may add variation between vials. A repeatability study keeps conditions closely controlled over a short period. Intermediate precision describes wider variation within a lab under conditions such as different days, analysts or equipment.
Count the observations at the level relevant to the question. If you prepare three solutions and inject each twice, the six injections provide information about measurement variation within preparations. They still represent three independent preparations. A suitable analysis can retain that grouping so readers can see which level of variation is being estimated.
JCGM VIM, Measurement precision, §§ 2.15 and 2.20–2.25 · Eurachem, The Fitness for Purpose of Analytical Methods, 3rd edition
Calculate the mean, standard deviation and RSD
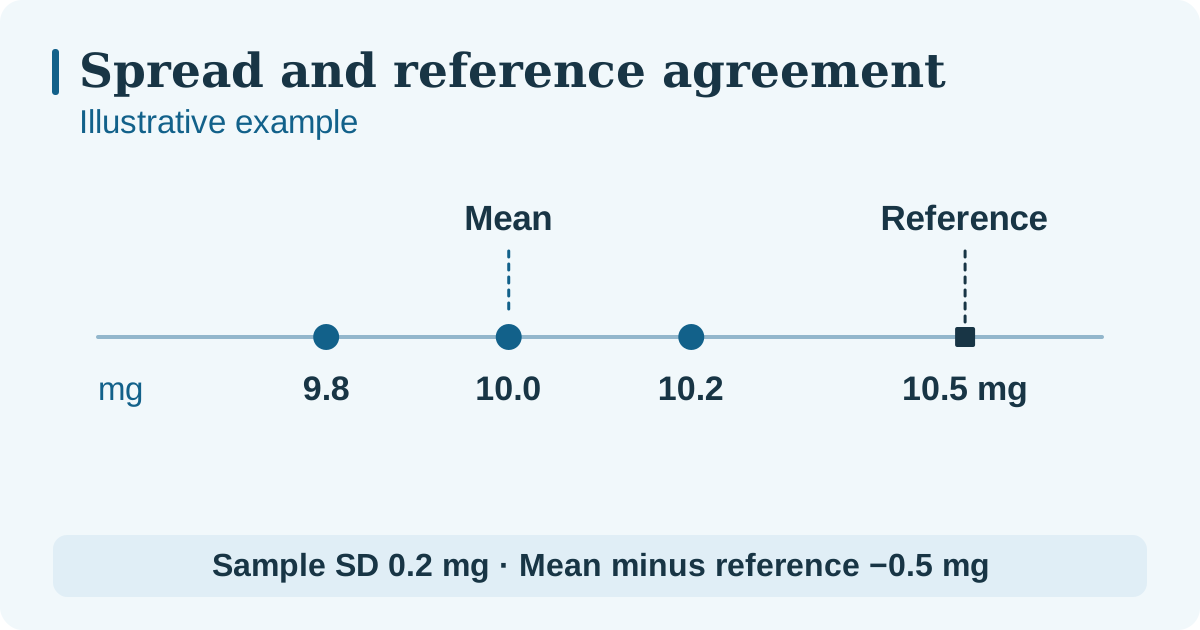
Consider fictional values of 9.8, 10.0 and 10.2 mg from three independent preparations of the same reference material. The mean is (9.8 + 10.0 + 10.2) ÷ 3 = 10.0 mg. Subtracting the mean from each result gives −0.2, 0 and +0.2 mg. The squared deviations sum to 0.08 mg². Divide by n − 1 = 2 and take the square root to obtain a sample standard deviation of 0.2 mg.
For these positive values on a ratio scale, the relative standard deviation (RSD) is 100 × 0.2 ÷ 10.0 = 2.0%. When the mean is close to zero the ratio can change drastically with small changes in the data. For meaningful comparison, retain the standard deviation in the original unit, the sample size and the measurement conditions. With three values the estimated spread remains sensitive to any one observation.
NIST/SEMATECH, Measures of scale · NIST Dataplot, Coefficient of variation
Check the difference from an assigned reference
Suppose the reference material’s assigned value for the same quantity is 10.5 mg. The observed mean minus the reference is −0.5 mg, or approximately −4.8% relative to the reference. This observed difference helps assess possible bias. Check the reference value’s uncertainty, the uncertainty of the estimated mean and whether the reference was subjected to the relevant preparation steps before drawing a conclusion about the procedure.
If the observations were independent with a common variance, the estimated standard error of the mean from this repeatability component would be s ÷ √n, or about 0.12 mg. That calculation uses the variation observed here. Other contributions, including the reference and calibration, may still matter for a comparison or for reporting measurement uncertainty.
Report the raw values and the conditions alongside the summary. A useful note for this example is “Three separate preparations, single day and analyst. Mean 10.0 mg, s = 0.2 mg, RSD 2.0%. Mean minus assigned value −0.5 mg.” If you excluded an observation, record the original value and the rule used.
JCGM VIM, Measurement trueness · Eurachem, The Fitness for Purpose of Analytical Methods, 3rd edition
Compare two replicate designs
These fictional data sets describe the same quantity in mg. Each row defines what counted as one observation.
| Design and observation unit | Raw readings (mg) | n | Mean (mg) | Sample SD (mg) | %RSD | Precision interpretation |
|---|---|---|---|---|---|---|
| Repeat injections · one result per injection of one prepared sample | 9.8, 10.1, 10.1 | 3 | 10.0 | 0.1732 | 1.73% | Describes short-run injection and measurement variability with preparation held fixed. Calculate repeat injections. |
| Independent preparations · one result per separately prepared portion | 9.5, 10.3, 10.2 | 3 | 10.0 | 0.4359 | 4.36% | Captures preparation and measurement under these conditions. Three observations give a limited estimate and do not separate the contributions. Calculate independent preparations. |
Reference comparison. If a suitable reference has an assigned value of 10.5 mg on the same basis, each example mean is 0.5 mg lower. That difference is separate from the spread of each set of replicates and needs its own uncertainty context.