Not Detected vs. Below LOQ: How to Record Laboratory Results
Interpret LOD, LOQ and laboratory qualifiers, with examples of dilution, differing limits and data entry.
The detection limit describes a procedure’s ability to detect an analyte under defined conditions. The quantitation limit describes the lowest level it can quantify with suitable performance. Keep an ‘ND’ or ‘below limit’ qualifier with its stated limit and units.
Identify which limit the laboratory used
An analytical report may name a detection limit (LOD or DL), quantitation limit (LOQ or QL), or a reporting limit. The detection limit relates to distinguishing an analyte from background under specified criteria. The VIM definition refers to specified probabilities of false detection and false absence. The quantitation limit addresses quantitative performance, such as precision and accuracy at low amounts. A laboratory may apply a reporting limit set by a procedure, specification or agreement. Read the report’s definition before assigning a meaning to its abbreviations.
Copy the analyte, method, sample matrix, units and the basis of the limit. Ask whether the limit applies to the instrument solution or the original sample after the effects of preparation and dilution are accounted for. A limit stated in the sample’s units is usually easier to compare to a study requirement.
JCGM VIM, Detection limit · ICH Q2(R2), Validation of Analytical Procedures, corrected April 2025 · Eurachem, The Fitness for Purpose of Analytical Methods, 3rd edition
Interpret three fictional results
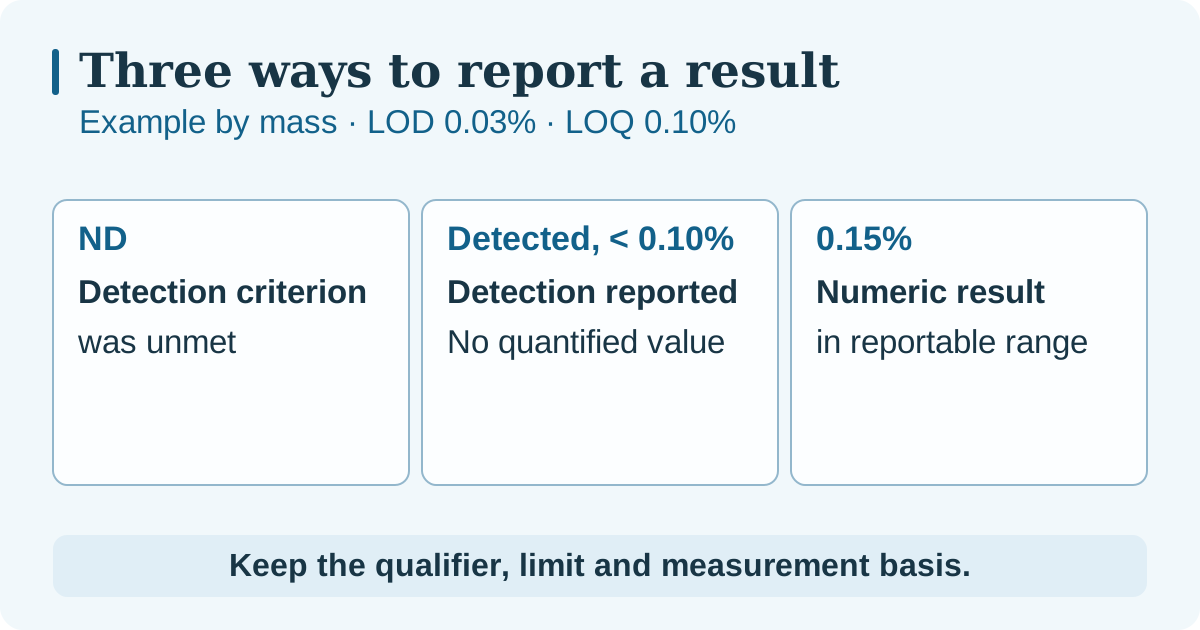
Assume a method defines its LOD as 0.03% and its LOQ as 0.10% by mass in the original sample. “Not detected” means the sample did not meet the method’s detection criterion. Keep “ND” with the stated 0.03% detection limit if the lab defines it that way. That result records the outcome of the test under those conditions, with the possibility of missed detection near or below the limit.
“Detected, below 0.10%” can mean the signal meets the detection criterion but the laboratory’s reporting policy supplies only a qualifier below its quantitation limit. Preserve both parts. An unqualified 0.15% can be read as a numerical result if it lies within the demonstrated reportable range and the method applies to the sample. A bare “<0.10%” may leave the detection status unspecified. Check the report legend before grouping it with either of the other qualified results.
JCGM VIM, Detection limit · ICH Q2(R2), Validation of Analytical Procedures, corrected April 2025 · Eurachem, The Fitness for Purpose of Analytical Methods, 3rd edition
Compare limits on the same sample basis
Suppose a fictional instrument solution has a quantitation limit of 0.020 mg/L. A tenfold dilution of the original solution before measurement gives a corresponding 0.20 mg/L limit in the original solution if the simple dilution correction is the only required factor. Other preparation steps, recovery corrections and a different sample matrix may require a different evaluation.
In another comparison, two reports use “ND,” with original-sample detection limits of 0.03% and 0.30% by mass. Both say the detection criterion was unmet in the respective test. The lower stated detection limit provides information about smaller amounts under the method’s conditions. Comparability still depends on the analyte, matrix, units and reporting rule.
Eurachem, The Fitness for Purpose of Analytical Methods, 3rd edition
Preserve the qualifier in the dataset
Keep the original reported text, quantitative value if given, qualifier, limit type, limit value and units in the data record. If the report gives only “detected, <0.10%,” leave the measured-value field empty and store the qualifier and limit. A numerical zero would add a measured value the report never gave. If an analysis uses qualified observations, document the method used and each applicable limit so a later analyst can reproduce the treatment.
The fictional method specifies a 0.03% detection limit and a 0.10% quantitation limit in the original sample, both by mass. Blank measured-value cells represent unreported numbers. For the last row the report legend gives no detection convention for < LOQ.
| Original result text | Original qualifier | Measured value | Unit | Applicable limit type | Limit value | Detection status |
|---|---|---|---|---|---|---|
| Not detected | Not detected | % by mass | LOD | 0.03 | Detection criterion unmet | |
| Detected below LOQ | Detected below LOQ | % by mass | LOQ | 0.10 | Detected, not quantified | |
| 0.15% | 0.15 | % by mass | LOQ | 0.10 | Quantified in reportable range | |
| < LOQ | < LOQ | % by mass | LOQ | 0.10 | Open. Ask the laboratory for its reporting convention. |
Copy the tab-separated rows into a worksheet. The repeated tabs preserve the empty fields.
original_text	original_qualifier	measured_value	unit	limit_type	limit_value	detection_status
Not detected	Not detected		% by mass	LOD	0.03	Detection criterion unmet
Detected below LOQ	Detected below LOQ		% by mass	LOQ	0.10	Detected, not quantified
0.15%		0.15	% by mass	LOQ	0.10	Quantified in reportable range
< LOQ	< LOQ		% by mass	LOQ	0.10	Open. Ask the laboratory for its reporting convention.